


Understand what your gut health results really mean
See your biomarkers in context with a comprehensive panel.
- CLIA-certified labs
- HIPAA compliant
- Personalized health protocol
A snapshot of the microbial community living in your gut
A microbiome diversity test analyzes the DNA or RNA in a small stool sample to identify which microorganisms live in your digestive tract and in what proportions. Modern sequencing methods, such as 16S rRNA profiling and metagenomic analysis, can characterize bacterial diversity in your gut, highlight beneficial and potentially harmful species, and estimate functional capacity, like the potential to produce short-chain fatty acids. Your results reflect a current snapshot of your gut ecosystem rather than a permanent trait. Just as your playlist changes with your mood, your microbial community shifts with diet, stress, medications, sleep, and travel.
Why diversity is a useful health gauge
Why that matters: gut microbes influence how you break down food, modulate inflammation, train the immune system, and even participate in mood signaling through the gut–brain axis. A diverse, stable microbiome is often associated with efficient digestion, better barrier integrity, and more balanced immune activity. While this science continues to evolve, patterns of higher diversity and steady composition are consistently linked with greater gut resilience across populations, though individual variation is substantial.
Your microbiome interacts with nearly every system that regulates how you feel day to day. Diversity is a practical gauge of that ecosystem’s stability. When diversity dips, a few species can dominate, increasing the risk of gas production, local inflammation, and fragile digestion. Testing helps surface these patterns. If you have persistent bloating, irregularity, or food-triggered discomfort, diversity data can clarify whether your microbial community has become less robust. If you recently took antibiotics, adopted a restrictive diet, or experienced high stress, a test can show how those changes may have shifted microbial balance. For athletes, the gut can influence fueling, recovery, and immune readiness; for people focused on skin or metabolic health, the microbiome can sway inflammatory tone and glycemic responses. Think of the report as a map of traffic on your gut’s freeway: smooth flow versus gridlock helps explain symptoms, not just label them.
Zooming out, the gut microbiome sits at the crossroads of immune regulation, metabolic health, and brain–gut signaling. Large cohort studies associate higher microbial diversity with lower markers of systemic inflammation and more favorable metabolic profiles, though causality is still being investigated. Over time, rechecking diversity can show whether your daily inputs — fiber variety, sleep regularity, movement, and stress management — are cultivating a more resilient microbial mix. Life stage matters, too: pregnancy naturally shifts the microbiome to support energy balance and immune protection; infants and older adults show different baseline patterns compared with young adults. Results are not a diagnosis and should be interpreted alongside your history, symptoms, and other labs. Technical details also matter: different assays (16S vs. shotgun metagenomics), reference databases, and sampling timing can yield slightly different views. That is normal in microbiome testing and is one reason trendlines and clinical context carry more weight than a single number.
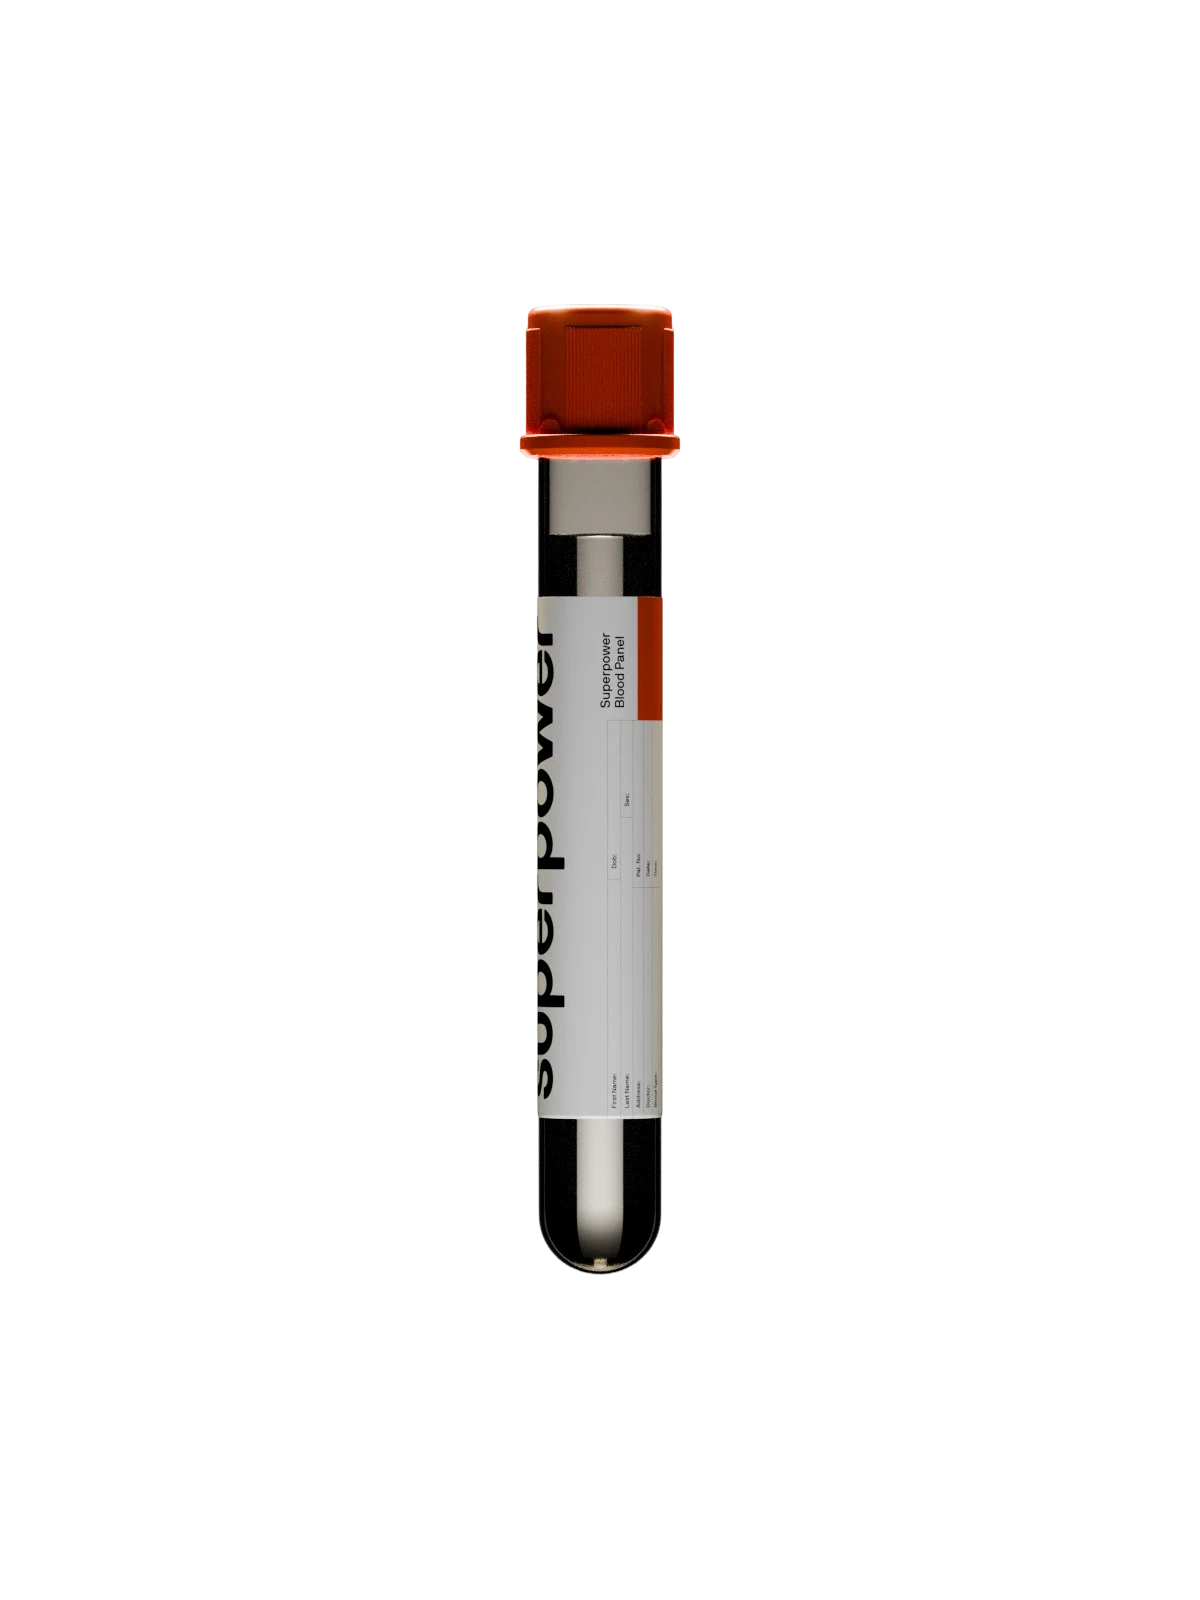
Test 150+ biomarkers
Two blood draws. A full picture of your health, explained in plain language.
Test 150+ biomarkers
Two blood draws. A full picture of your health, explained in plain language.
Reading a diversity profile
Most reports present the relative abundance of microbial groups and functional pathways, compared against a reference population. A “balanced” pattern often includes higher overall diversity, with meaningful presence of beneficial genera such as Bifidobacterium and Faecalibacterium. Lower diversity or notable overrepresentation of a few species can suggest an ecosystem under strain.
When diversity is robust, it usually signals efficient fermentation of fibers into short-chain fatty acids like butyrate, which support colon cells, help maintain a tight intestinal barrier, and modulate local inflammation. In practice, that can look like steadier digestion and less reactivity after meals. There is no single perfect value — optimal ranges vary by geography, dietary pattern, and personal physiology — but stable, diverse patterns tend to correlate with better resilience.
When results point to dysbiosis, you may see reduced diversity, enrichment of inflammation-associated taxa, or lower representation of beneficial fermenters. These findings don’t diagnose disease; they highlight biological patterns that can be explored with your clinician. Mechanistically, fiber variety feeds a broader set of microbes, movement improves gut motility and microbial metabolite signaling, and sleep regularity supports circadian rhythms that microbes also follow. If symptoms persist, medical evaluation may be warranted to rule out conditions such as celiac disease, inflammatory bowel disease, or infections.
What a diversity test can and can't tell you
Big picture: microbiome diversity data are most powerful when paired with other biomarkers — like CRP for inflammation, metabolic markers for glycemic control, or nutrient panels — and interpreted over time. Integrated with your history, diet, and lifestyle, your results can help personalize strategies for digestion, energy, skin health, and long-term wellness, with the understanding that more research is ongoing and individual responses vary.
Frequently Asked Questions
References
- Falony G, Joossens M, Vieira-Silva S, Wang J, Darzi Y, Faust K, Kurilshikov A, Bonder MJ, Valles-Colomer M, Vandeputte D, Tito RY, Chaffron S, Rymenans L, Verspecht C, De Sutter L, Lima-Mendez G, D'hoe K, Jonckheere K, Homola D, Raes J (2016). Population-level analysis of gut microbiome variation. *Science*, *352*(6285), 560-564. https://doi.org/10.1126/science.aad3503
- Afzaal M, Saeed F, Shah YA, Hussain M, Rabail R, Socol CT, Hassoun A, Pateiro M, Lorenzo JM, Rusu AV, Aadil RM (2022). Human gut microbiota in health and disease: Unveiling the relationship. *Frontiers in Microbiology*, *13*, 999001. https://doi.org/10.3389/fmicb.2022.999001
- Jovel J, Patterson J, Wang W, Hotte N, O'Keefe S, Mitchel T, Perry T, Kao D, Mason AL, Madsen KL, Wong, G. K.-S. (2016). Characterization of the gut microbiome using 16S or shotgun metagenomics. *Frontiers in Microbiology*, *7*, 459. https://doi.org/10.3389/fmicb.2016.00459
- Fusco W, Lorenzo MB, Cintoni M, Porcari S, Rinninella E, Kaitsas F, Lener E, Mele MC, Gasbarrini A, Collado MC, Cammarota G, Ianiro G (2023). Short-chain fatty-acid-producing bacteria: Key components of the human gut microbiota. *Nutrients*, *15*(9), 2211. https://doi.org/10.3390/nu15092211
- Drago L (2025). Navigating microbiome variability: Implications for research, diagnostics, and direct-to-consumer testing. *Frontiers in Microbiology*, *16*, 1580531. https://doi.org/10.3389/fmicb.2025.1580531


























 Heart & Vascular Health
 Metabolic Health
 Energy
 Liver Health
 Kidney
 Sex Hormones
 Thyroid Health
 Nutrients
 Immune System
 Inflammation